New York Times
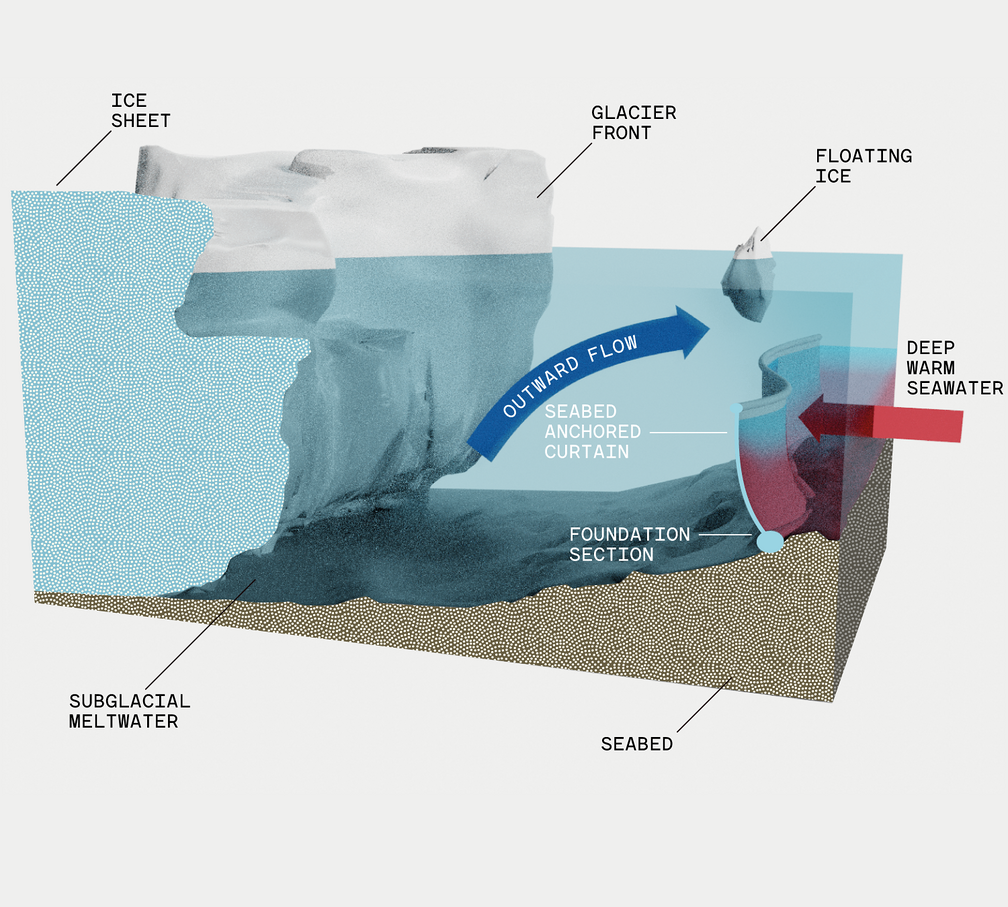
Can $500 Million Save This Glacier?
January 2024 – Information design for New York Times -- A bold engineering project might show a way to slow sea-level rise — and bring new imagination to the fight against climate change.
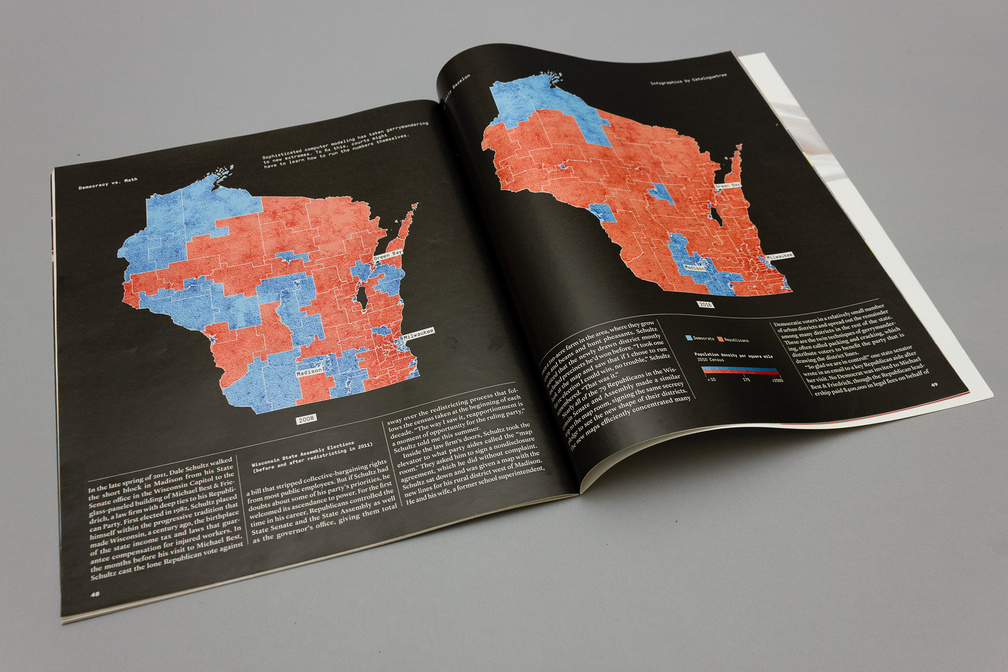
September 2017 – Maps and charts on the Wisconsin State Assembly elections for an article about Gerrymandering for New York Times Magazine.
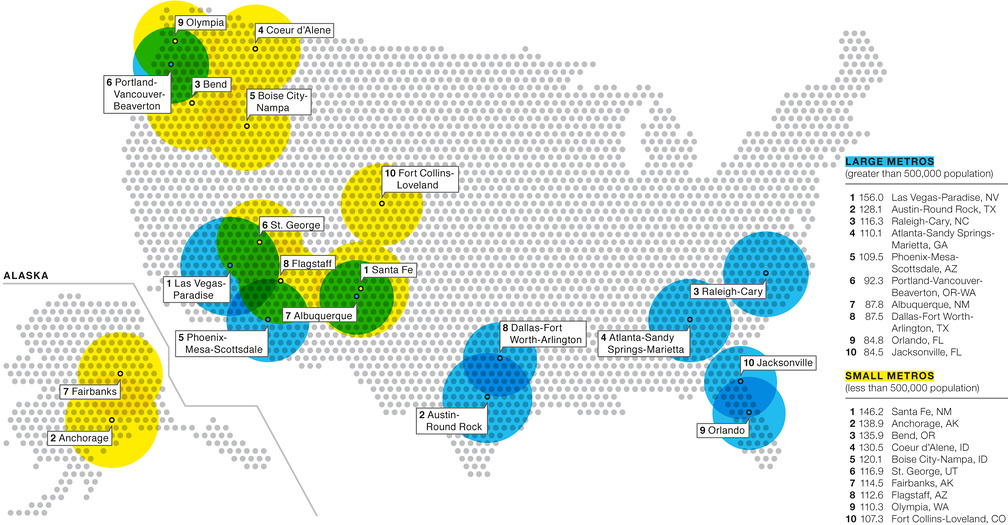
Where the retirees will be
October 2007 – Chart for Key, the New York Times Real Estate Magazine showing cities in the U.S. with a high percentage of retirees.
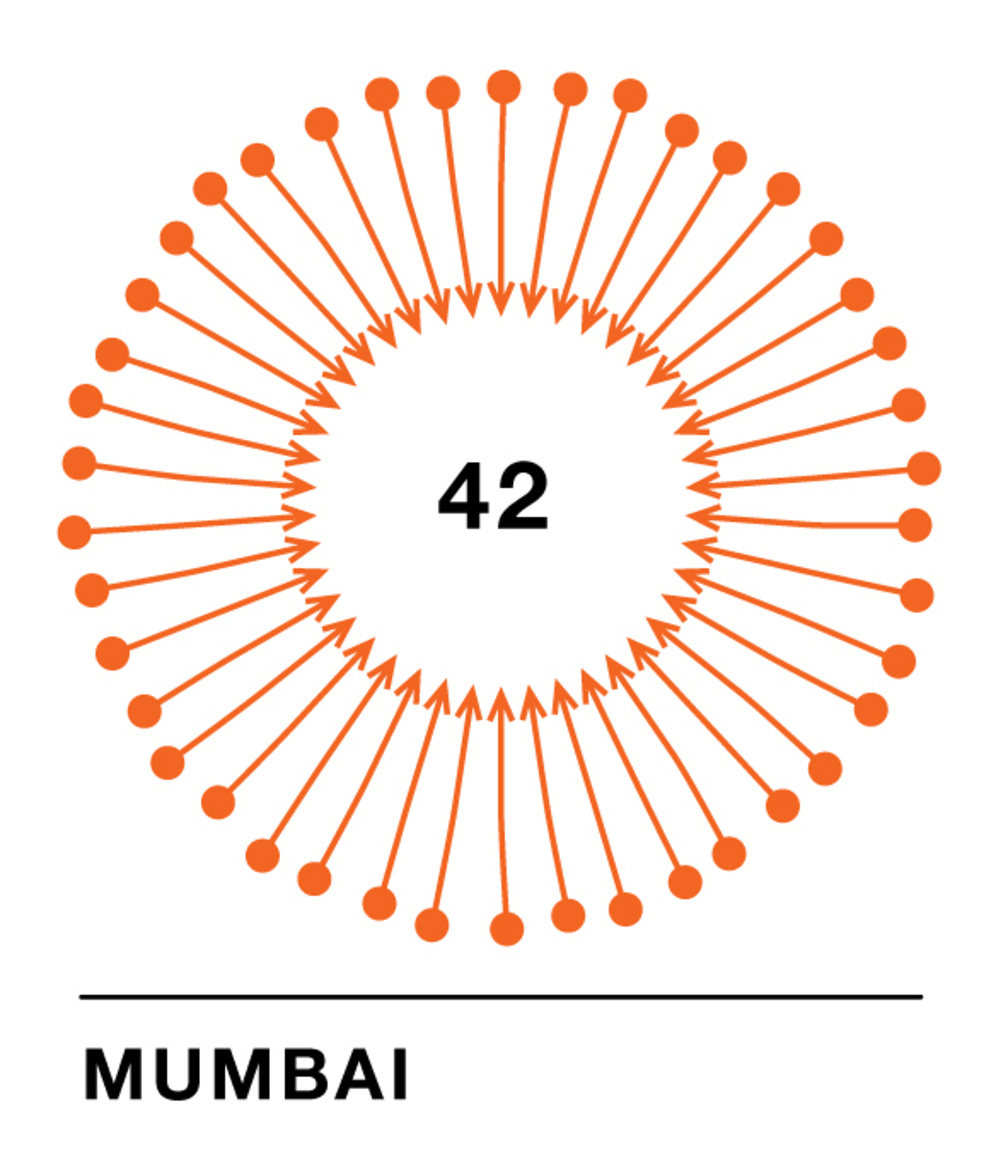
June 2007 – Series of Infographics for 'The Way We Live Now' column of New York Times Magazine, New York (US) from January to June 2007.

Down the Middle
March 2007 – Chart for Key, the New York Times Real Estate Magazine about local housing markets in the U.S.
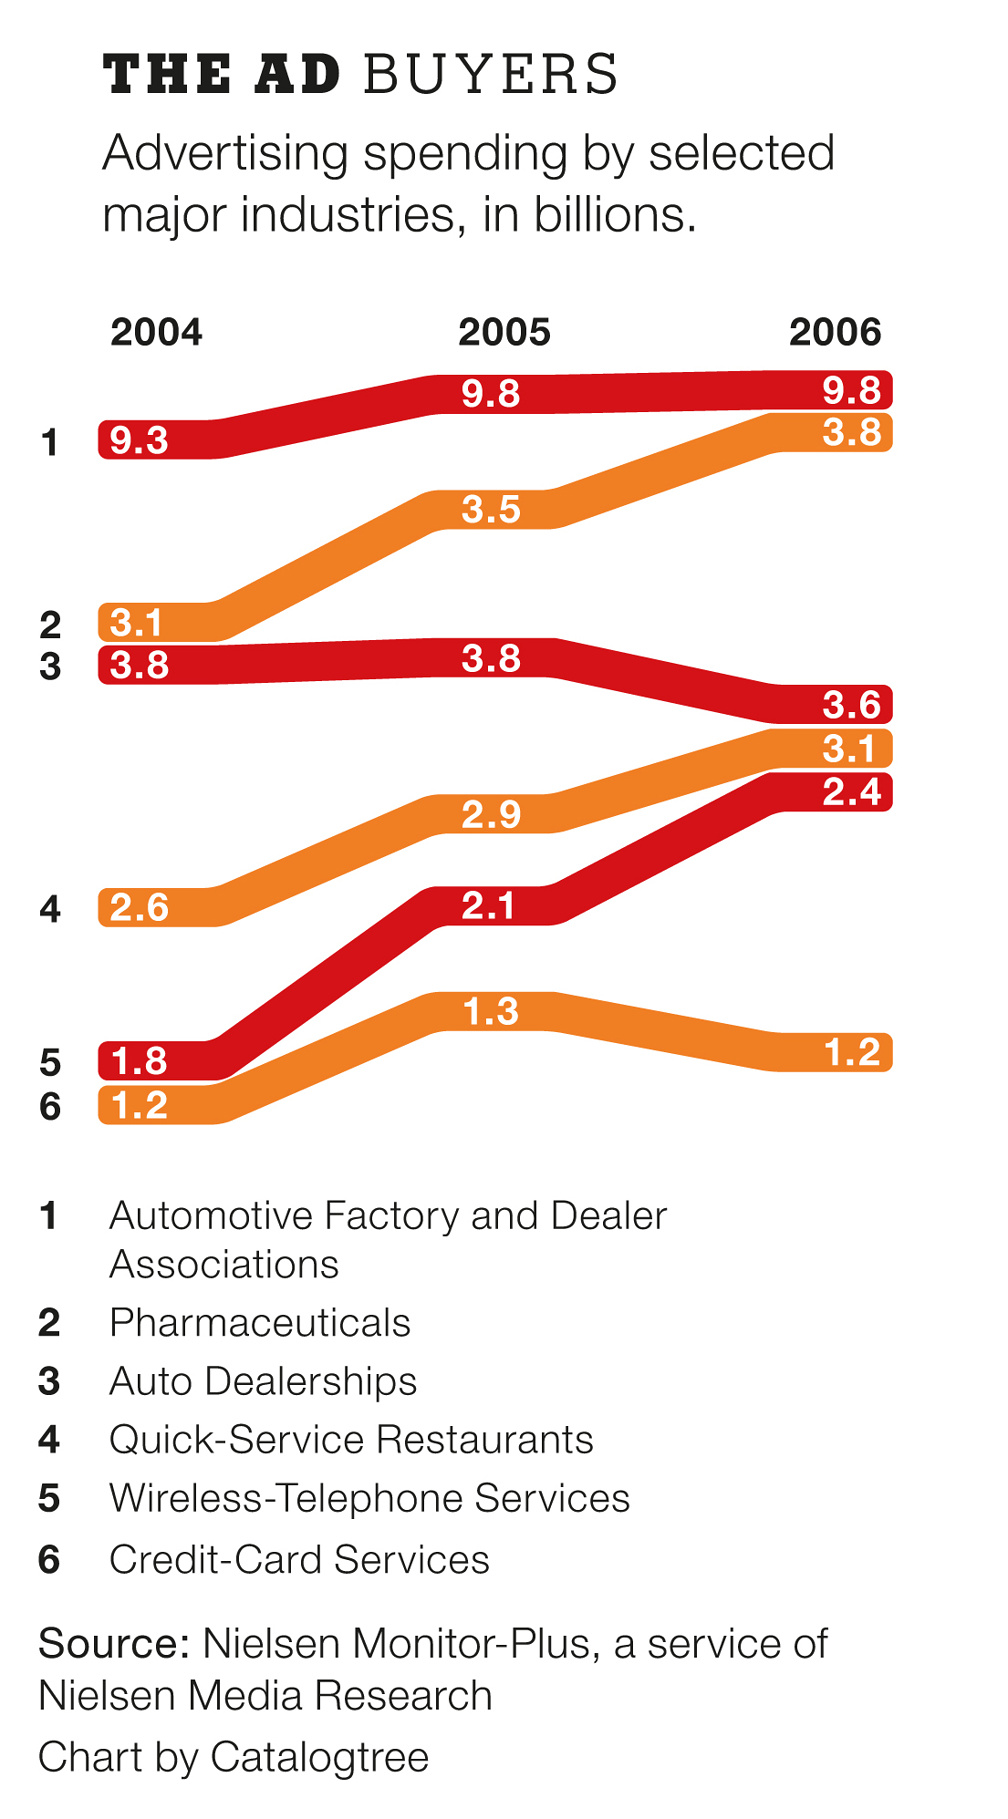
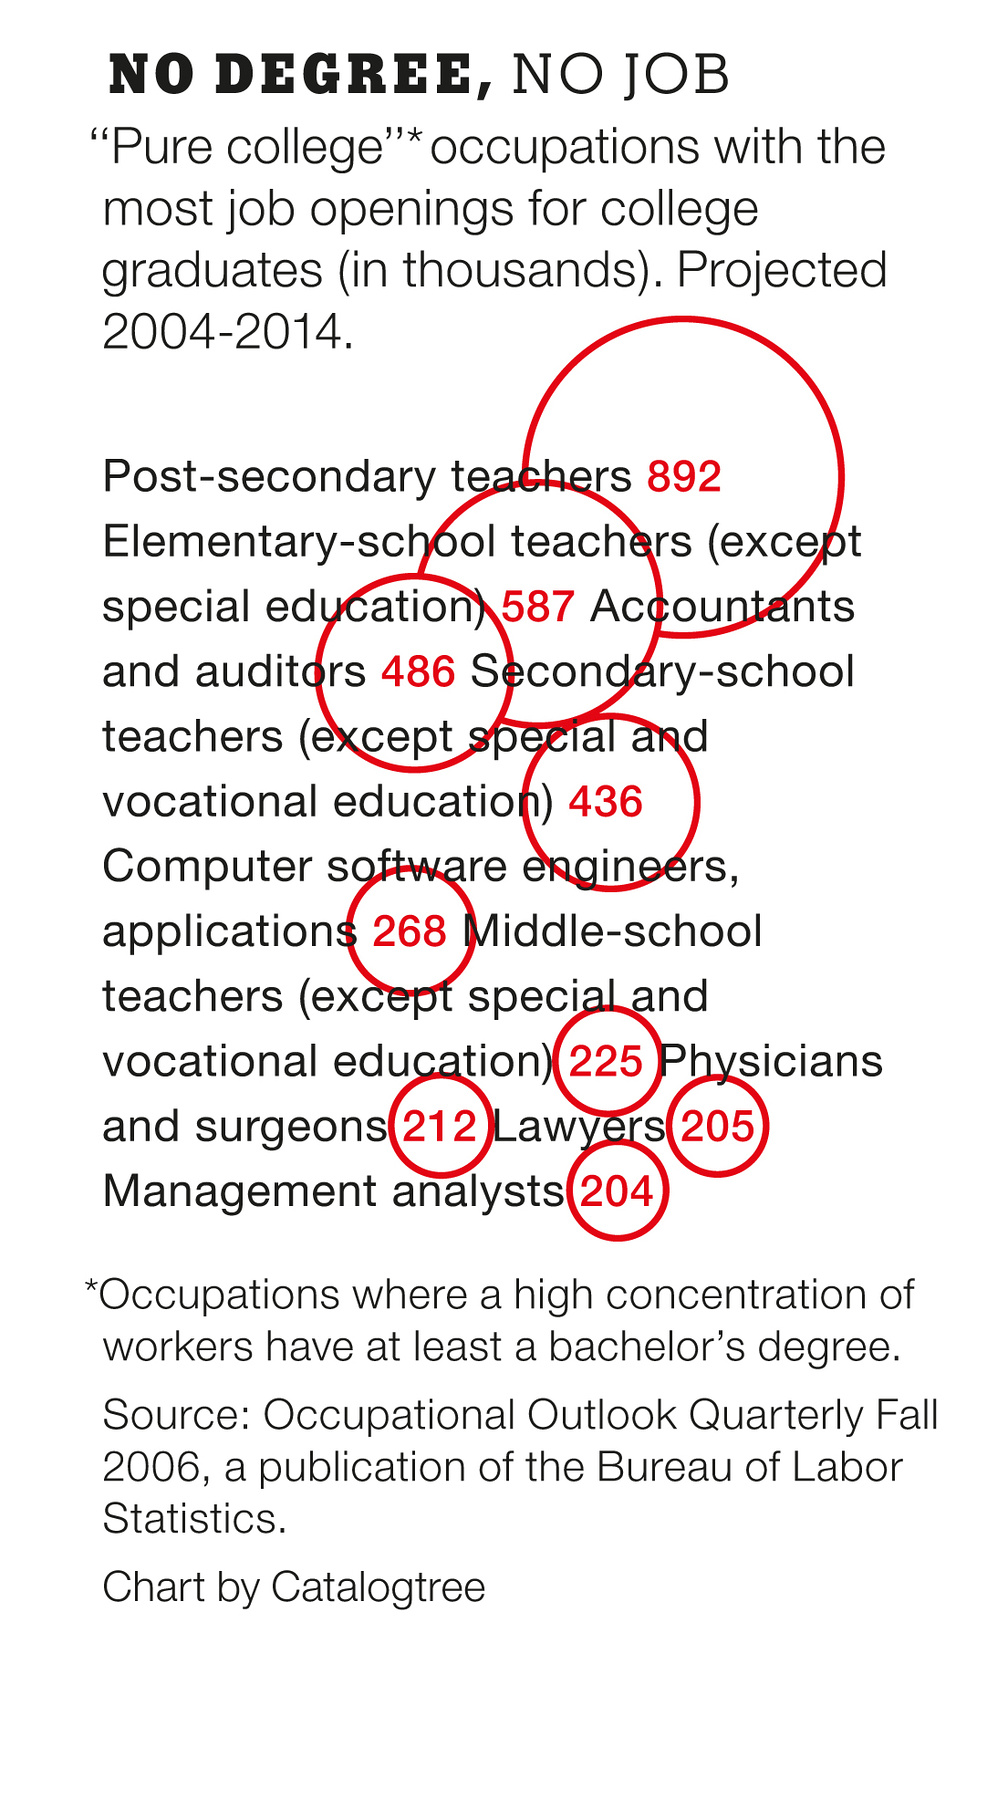
December 2006 – Infographics for 'The 6th Annual in Ideas' in The New York Times Magazine, New York (US).
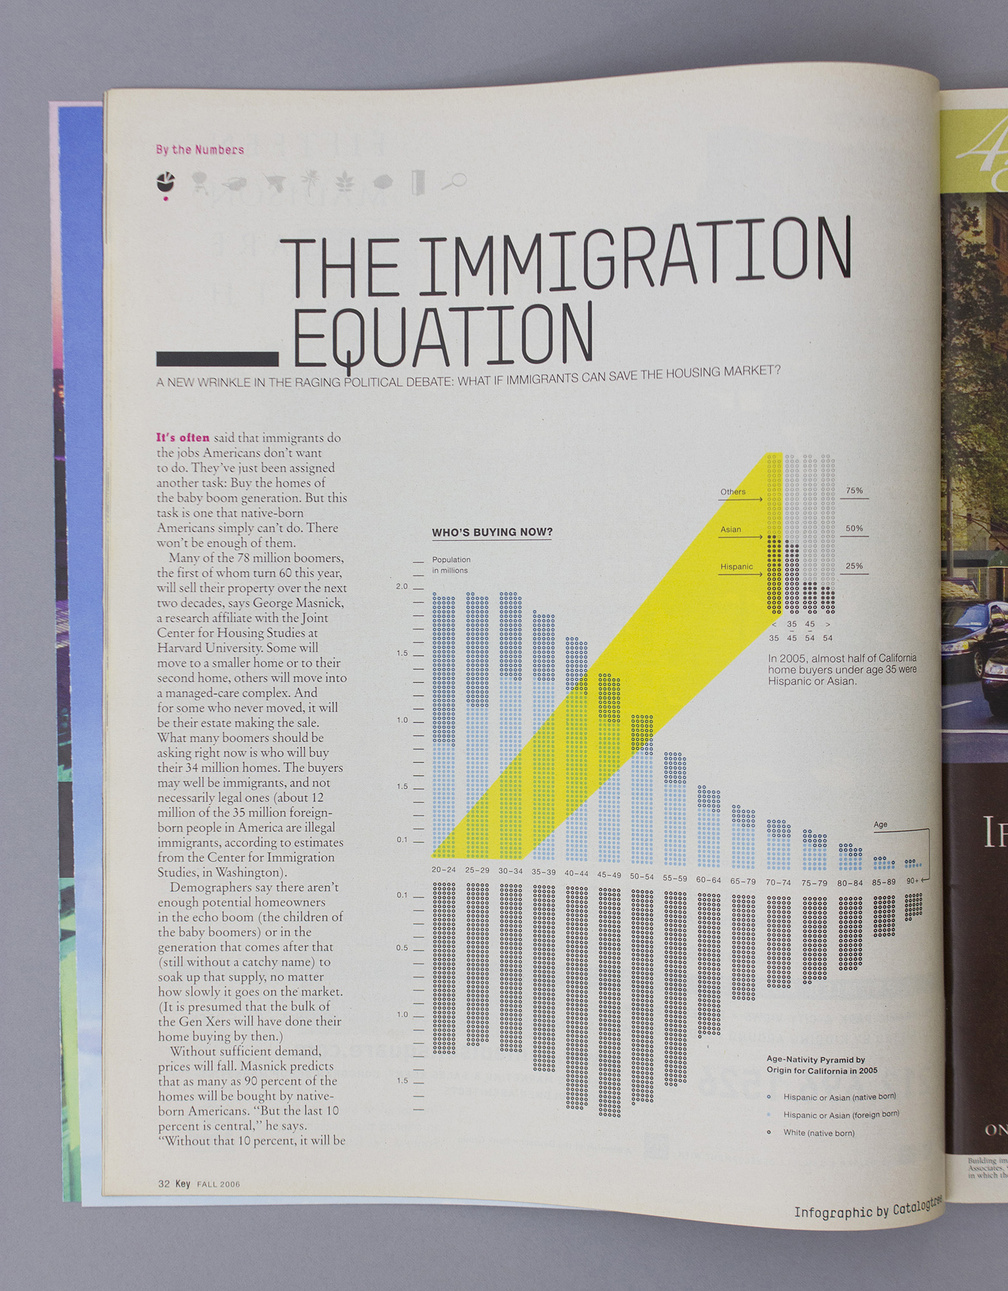
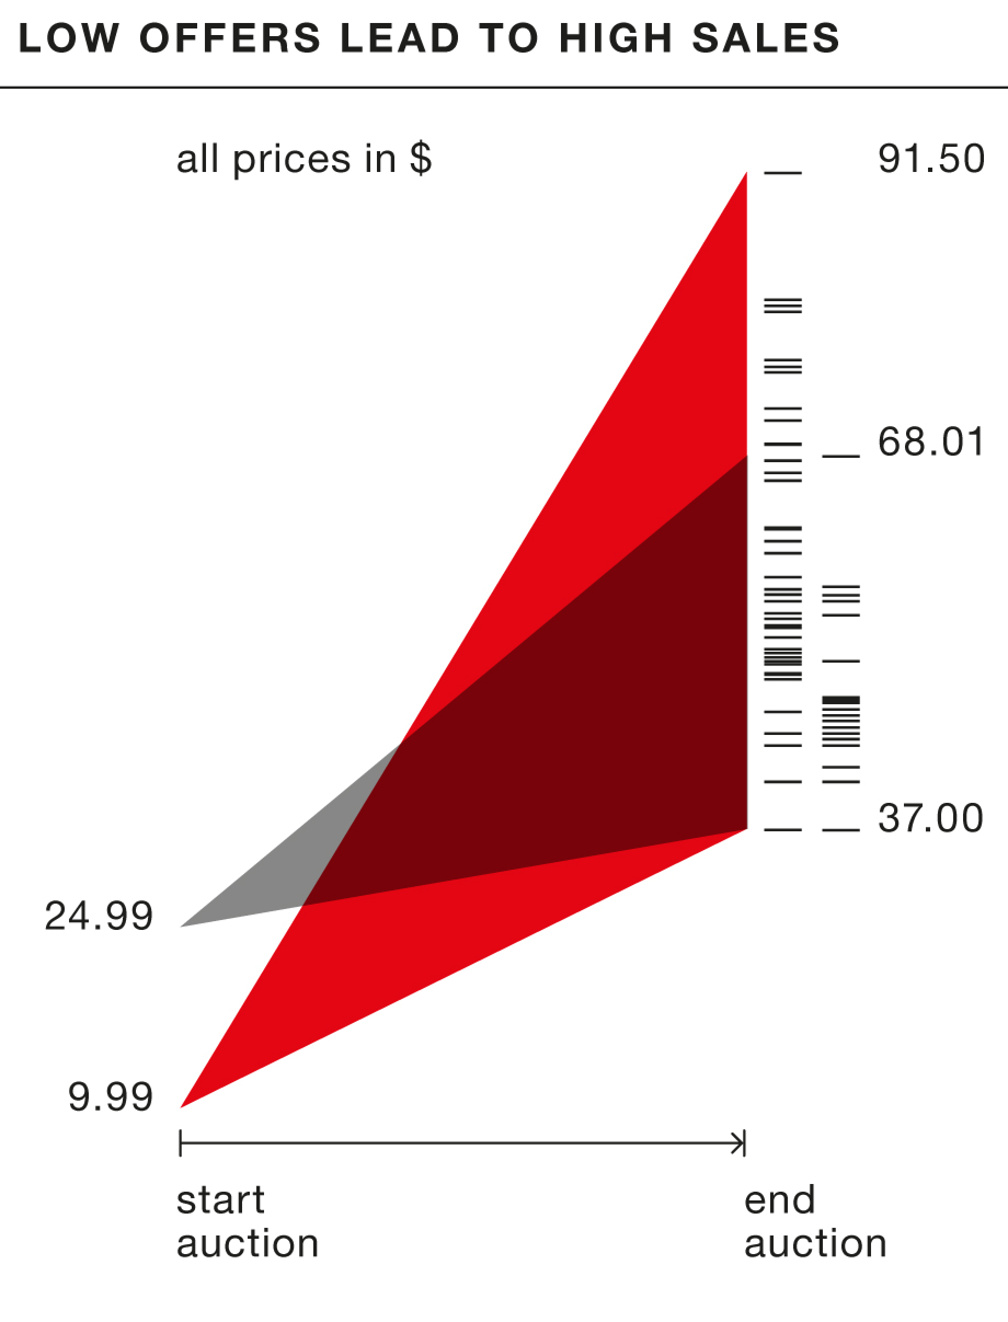
The Immigration Equation
August 2006 – Chart for the first issue of Key, the New York Times Real Estate Magazine about the influence of immigrants on the american housing market.